T.O. 33B-1-1
4-25
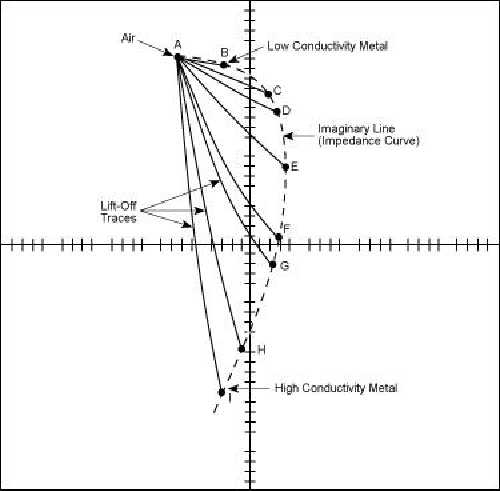
Figure 4-20. Impedance Diagram Illustrating Effects of Variable Conductivity
4.3.3.3
Typical Uses.
The impedance diagram shown in Figure 4-20 illustrates that the conductivity curve can be used to measure the relative
conductivity of an unknown material by comparing the position of its indication on the conductivity curve to the
positions of indications from known materials. Notice also that the lift-off lines are in a different direction than the
conductivity line. Changes in conductivity and lift-off are said to have different phase angles. This phase angle
difference is further illustrated in Figure 4-21.

