T.O. 33B-1-1
4-21
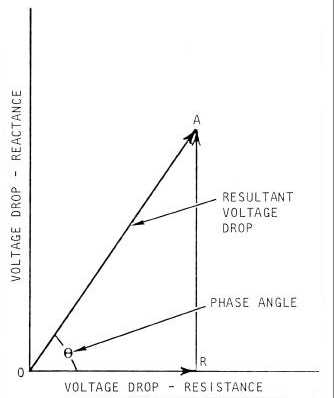
other. This represents the two quantities being 90 degrees out of phase. The combination of the two quantities is
represented by the diagonal line OA that is at the angle q with respect to the voltage drop across the resistor.
Figure 4-16. Vector Diagram Showing Relationship between Resistance, Reactance, and Impedance.
4.3.2.4
Impedance Plane Representation.
Just as the two voltages can be combined to produce the net voltage across a coil as illustrated in Figure 4-17; the
resistive and inductive impedance components can be combined to produce the net impedance of a coil. In Figure 4-16,
inductive reactance (XL) is plotted on the y-axis and resistance (R) is plotted along the x-axis. These two values define
the impedance that is represented by the vector OA. The value of the angle q for the net impedance is the same as the
angle q illustrated in Figure 4-17 for the net voltage. This is important because it shows that the impedance of a coil
can be displayed as the combination of two out-of-phase voltage drops. The amplitude of the impedance may be
determined from the known values of resistance and inductive reactance according to the following formula:


