T.O. 33B-1-1
4-26
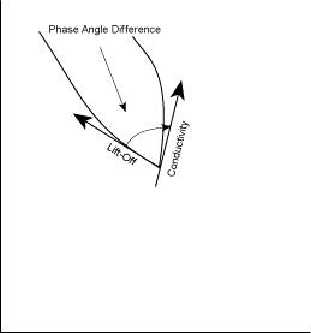
Figure 4-21. Phase Angle Difference between Lift-Off and Conductivity.
4.3.3.3.1
The lift-off curve can be used to measure the thickness of non-conductive coatings on a conductive surface. This is
done by comparing the length of lift-off line for an unknown coating thickness to the lengths of lift-off lines for known
thicknesses.
4.3.3.4
Normalization of Impedance.
To illustrate general principles of eddy current inspection or to present data in a universal form independent of specific
coil impedance values, impedance diagrams are usually normalized. In normalization, the inductive reactance and the
resistance of the coil on the part are divided by the value of the inductive reactance of the coil in air. Therefore, the
vertical axis of the impedance diagram equals the relative inductive reactance (XL,N) of the test coil; and the horizontal
axis of the impedance diagram equals the relative resistance (RN) of the test coil.
4.3.3.4.1
Normalization is a convenient method to allow comparisons of eddy current data from a large number of tests using
different probes and materials. The shapes of the impedance diagrams remain the same. However, the air null point A
in Figure 4-22 through Figure 4-23 becomes 1 on the y-axis of the impedance diagram after normalization. The
impedance diagrams in this manual will all be represented by the normalized reactance (XL,N) on the y-axis and
normalized resistance (RN) on the x-axis.
4.3.3.5
Effects Of Test Part Properties and Inspection Parameters on Impedance Diagrams.
4.3.3.5.1
Conductivity and Frequency.
An identical diagram could be developed to show the effect of changing frequency. One point on the curve would be
established by nulling the probe in air and placing the probe on a specimen. Then, other points would be obtained by
changing the test frequency, nulling the probe in air again, and placing the probe on the same specimen. After the data
is normalized, a plot would be created. With increasing frequency the impedance of the probe on the specimen would
move in the same direction as an increase in conductivity of the specimen. A decrease in frequency would cause the
probe impedance to move in the same direction as a decrease in conductivity. The relationship between conductivity
and frequency allows experience obtained from the eddy current inspection of one alloy to be transferred to the
inspection requirements for an alloy of different conductivity by changing the frequency of inspection. As an example,


