T.O. 33B-1-1
4-23
secondary magnetic field from the induced eddy currents. This is equivalent to increasing both the inductance and
resistance of the coil. In this manner changes in a part that affect either the strength of the magnetic field at the surface
of the part or the strength and distribution of the eddy currents in the part, change the apparent impedance of the test
coil(s). These variations in current flow, both phase and amplitude, can be detected, amplified, displayed and analyzed
as eddy current test results. The amplitude and phase changes in the signals can be related to changes in the parts
inspected.
4.3.3
Impedance Diagrams.
4.3.3.1
Purpose.
The impedance diagram shows how changes in eddy current test variables change the apparent impedance of a coil.
Typical variables displayed are electrical conductivity, relative magnetic permeability, fill-factor or lift-off, part
thickness, and test frequency. Impedance diagrams are very useful for determining optimum inspection parameters and
understanding eddy current results when more than one variable is changing.
4.3.3.1.1
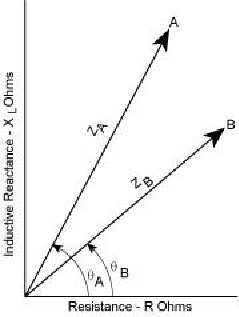
The vector representation of inductive reactance on the y-axis and resistance on the x-axis of Figure 4-16 is the basis of
the impedance diagram. Let the point A represent the impedance of a test coil while on a part. If the probe is moved to
a place on the part with a flaw, the impedance will change. This new impedance can be represented by the point B, as
shown in Figure 4-18. Each change in the impedance will create a new point on the diagram.
Figure 4-18. Vector Representation of Impedance
4.3.3.2
Development of an Impedance Diagram.
To make the impedance diagram into a useful tool for understanding eddy current testing, it is necessary to
systematically change a single test parameter such as conductivity, and observe the changes in the impedance. Using
an eddy current instrument with a two dimensional graphical display (such as the NORTEC-19EII, MIZ-12, MIZ-17, or
MIZ-20), a surface probe, a piece of ferrite (a nonconductive, ferromagnetic ceramic) and several nonmagnetic metal
specimens representing a range of conductivity’s from low (titanium, Inconel) to high (copper, silver), approximate
impedance diagrams can be developed and demonstrated. The specimens must have clean, flat, and bare surfaces.
When the eddy current probe is held away from the part (in the air) and the instrument is nulled, an indication (spot)


