T.O. 33B-1-1
4-28
4.3.3.5.4
Thickness Variations.
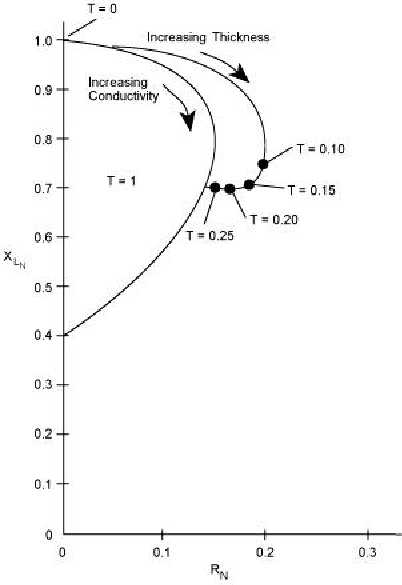
When the part thickness is less than the effective depth of penetration of the test coil at the inspection frequency
employed, the impedance curve departs from the conductivity curve as shown in (Figure 4-23) Typically, there is an
increase in the resistive component of the impedance with thinner parts, as compared to parts that have thicknesses
equal to or greater than the effective depth of penetration (see paragraph 4.2.3.3.2). As the thickness of the parts
increase and approach more closely the effective limit of penetration, the curve tends to spiral as it approaches the end
point (T=1) on the conductivity curve, where T equals the ratio of the specimen thickness to the effective depth of
penetration in that specimen.
Figure 4-23. Impedance Diagram Showing the Effect of Specimen Thickness.
4.3.3.5.5
Conductive Layers.
The impedance curve for thin conductive layers on a substrate of different conductivity is also represented as a
deviation in the impedance curve for conductivity. The impedance for the layered material departs from the
conductivity curve at the value corresponding to the substrate conductivity and forms a loop that rejoins the
conductivity curve at the conductivity of the metal in the outer layer. Increasing thickness of the outer layer