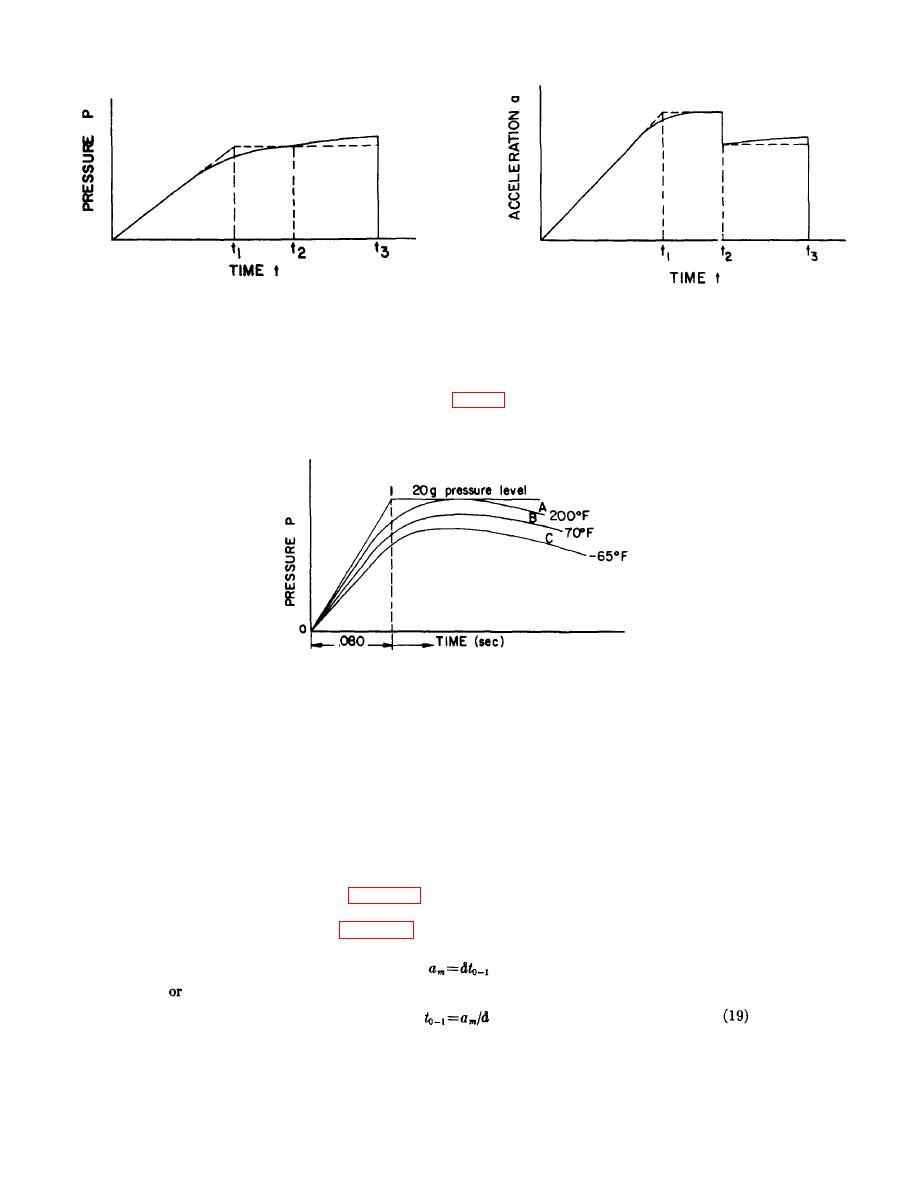
Figure 43. Desired pressure vs time curve.
Figure 44. Acceleration vs time curve
corresponding to desired pressure vs time curve.
B and C). Since the final velocity imparted by the catapult is proportional to the area enclosed by the
pressure-time curve, it is evident (from fig. 45) that the catapult must be designed so that acceptable
performance results at both extremes of allowable temperature.
Figure 45. "Ideal" pressure characteristic curve compared with typical empirical curves.
(2) Use of "Ideal" acceleration vs. time curves to estimate stroke length.
(a) Based upon the discussion of the preceding paragraph, the following derivation illustrates a method
for determining the approximate acceleration, velocity, and travel vs. time curves for a three-tube
catapult system.
(b) Several assumptions are made in the derivation:
1. The strokes of the telescoping and inner tubes of the catapult are equal and the inner tube
moves only upon completion of the stroke of the telescoping tube.
2. The ratio of the inner tube to the area of the telescoping tube (hereinafter called the tube area
ratio) is equal to 0.82. This figure is representative of the catapults developed for pilot ejection.
the dashed lines of figure 43 and as described in the preceding paragraphs. The basis for this
derivation is the acceleration-time curve for a three-tube catapult shown by the dotted line
approximation of figure 44. The subscripts 1, 2, and 3 refer to increments of acceleration,
velocity, or travel over the times t0-1, t1-2, and t2-3, respectively.
50


