T.O. 33B-1-1
5-5
5.1.3.3.1
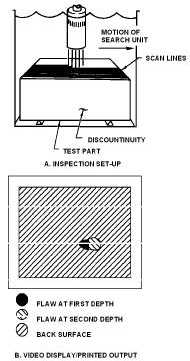
B-Scan.
This is a means of data presentation that provides a cross-sectional view of the test piece under the scan path of a
search unit. This requires a device that transfers the movement of the search unit to the sweep of the video display
while the distance/depth information from the ultrasonic beam is used to vertically position the sweep to indicate the
relative positions of part surfaces and internal discontinuities. This method of presentation is rarely used.
5.1.3.3.2
C-Scan.
This is a means of data presentation, which provides a plan view of the material and discontinuities therein. This is
accomplished by coupling a selected (electronically gated) output of an A-scan presentation to a x-y recorder or a video
display. Discontinuities are indicated at positions corresponding to the actual x-y locations of the discontinuities in the
part (see Figure 5-6). Devices to track and relay search unit position to the recorder or display are required. The video
displays, usually in color, are produced after the analog signal is converted to digital data. The display can be adjusted
so that the colors represent different depths or thickness if several gates are used. Alternatively, the signal amplitude is
displayed in various colors.
Figure 5-6. Typical C-Scan Inspection and Presentation.
5.1.3.4
Relationship of A Scan Waveform Display to Distance.
In a test part containing a discontinuity, ultrasonic energy is reflected as echoes from the discontinuity and the back
surface of the test part. Referring back to Data Presentation Method, there are three methods of data presentation used
for ultrasonic inspection: A-scan, B-scan and C-scan. Notice the positions of the displayed signals on the cathode ray
tube (CRT) in relation to the actual positions of the test-part front surface, discontinuity, and back surface. The
distance along the CRT base line is proportional to the distance to the discontinuity and back surface in the test part. In
Data Presentation Methods, there are three methods of data presentation used for ultrasonic inspection: A-scan, B-scan
and C-scan. The signals on the CRT were adjusted to position the initial pulse, on the grid marked “0” and the back
surface signal on the grid marked “5”. The discontinuity then appeared just to the right of the grid marked “1”. The
adjustment of the signals on the CRT was accomplished by varying two controls on the instrument: the Sweep Delay
and the Sweep Length or Range. The adjustment made each space between the vertical grid lines on the CRT
equivalent to 1 inch in the test part. Further information on operation of the ultrasonic equipment is contained in
section 5.2.