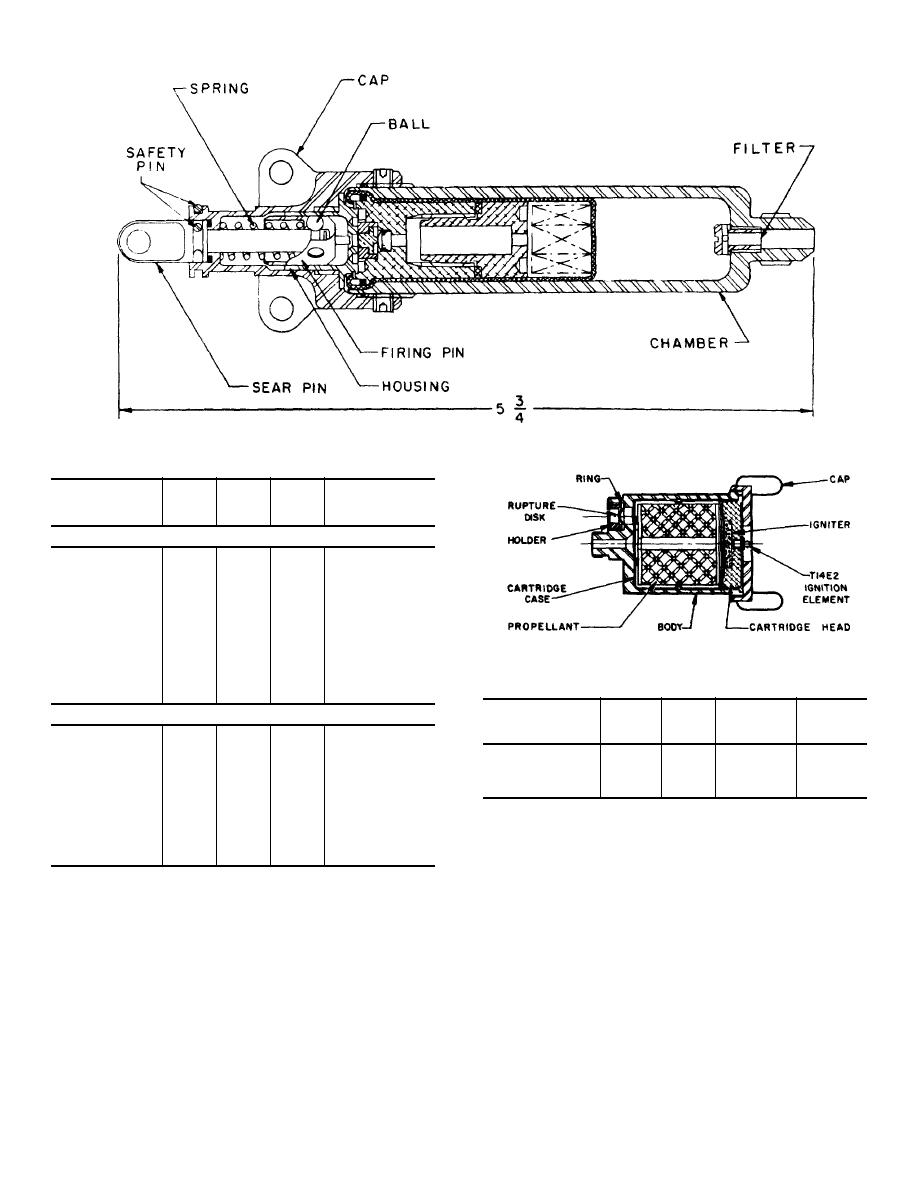
Figure 1. Mechanically operated initiator.
Table II. Comparative Data for Initiators
Peak pressure†
Weight
Chamber
Delay
Model
(lb)
volume
(sec)
(psi)
(in.*)
Mechanically operated
M4 .................
1.0
2.4 .......... 2
600(12)
M12................
1.0
2.4 .......... 1
600(12)
M3 .................
0.9
2.3 ............
1000(16)
M29................
1.6
2.3 ............
1000(15)
M27................
0.3
0.6 ............
1200(15)
T30E1 ............
0.3
0.6 ............
1200(15)
Figure 2. Gas generator.
M30................
1.1
2.6 .......... 2
1500(15)
M32................
1.1
2.6 .......... 1
1500(15)
Table III. Comparative Data for Gas Generators
M8 .................
2.2
4.3 ............
1800(30)
Weight
Chamber
Operating
Operating
Gas operated
Model
(lb)
volume
pressure
time
M6 ................ .
1.0
2.4 .......... 2
600(12)
(in.3)
(psi)
(sec)
M33................
1.0
2.4 .......... 1
600(12)
T3 ....................
25
100
2,000
90
M5 .................
0.9
2.3 ............
1000(15)
T4 ....................
30
50
1,500
480
M28................
0.3
0.6 ............
1200(15)
XM7 .................
0.75
0.3
†500
0.9
T31E1 ............
0.3
0.6 ............
1200(15)
† At the end of 2 feet of MS-28741-4 hose.
M10................
1.1
2.6 .......... 2
1500(15)
M31................
1.1
2.6 .......... 1
1500(15)
d. In the past few years, considerable progress has
M9 .................
1.8
4.3 ............
1600(30)
been made in miniaturizing initiators. For example, a
3
†Peak pressure in 0.062 in. gage located at the end of a
typical initiator, the M3, has a chamber volume of 2.3
length of MS-28741-4 hose. The number following the
cubic inches and weighs 0.9 pound. This device has
pressure indicates the length of hose in feet between the
been miniaturized in the form of the T25 initiator which
initiator and the gage.
has a chamber volume of only 0.65 cubic inch and
4


