T.O. 33B-1-1
6-72
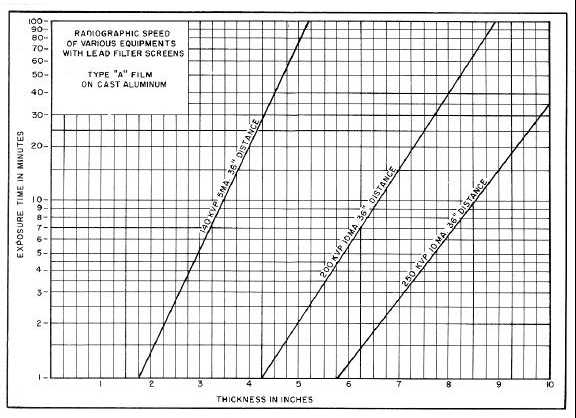
Figure 6-36. Typical Technique Constant-Density Chart.
6.7.4.4.1
Constant density charts may also be prepared directly from the radiographs if a set of constant exposure charts is not
desired. To do this proceed as follows
a. Select the exposure and thickness of the step wedge that will produce the density desired.
b. Plot this exposure of time versus the thickness of material on a sheet of semilogrithmic graph paper and
label this line with the kVp used for this series of exposures.
c. Repeat the above procedure for a series of voltages through the voltage range of the equipment.

