T.O. 33B-1-1
6-71
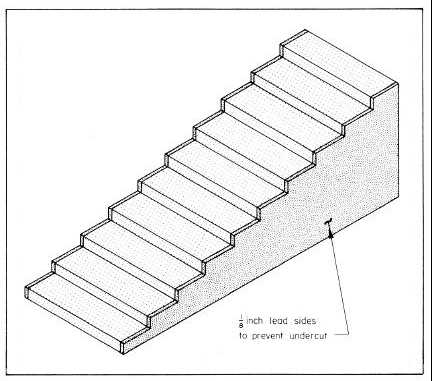
Figure 6-35. Sketch of Desirable Stepped Block for Radiation Measurements.
6.7.4.3
Plotting the Data.
NOTE
The Constant Exposure Chart is for a single kilovoltage setting. Additional curves
for other kilovoltages can be made by repeating the procedure at any desired
kilovoltage.
Make density measurements of each step of the radiographs with a densitometer and record this data in a table. The
final table should show a density for each step thickness at each exposure. Now plot this data on semilogrithmic graph
paper with density and object thickness as the coordinates. This will give a set of curves, one for each exposure. This
is a Constant-exposure chart and is only one type of technique chart.
6.7.4.4
Constant Density Charts.
It is more common to plot technique charts in the form shown in Figure 6-36. This is a constant-density chart for three
different kilovoltages. To prepare this type of technique chart, it is necessary only to plot points taken from the graph
prepared in Paragraph 6.7.4.3. Record and plot the points for each thickness at the intersection of the selected density
and exposure curves. This will result in a single curve on the constant density chart for one kilovoltage.